Published Wed 24 Nov 2021 03:32 by Technical Analyst
FOMC meeting minutes
The Federal Open Market Committee (FOMC) Meeting Minutes are a detailed record of the committee’s policy-setting meeting held about two weeks earlier.
The minutes offer detailed insights regarding the FOMC’s stance on monetary policy, so currency traders carefully examine them for clues regarding the outcome of future interest rate decisions.
This week’s minutes will detail the last meeting at which the policymakers decided that the economy is recovering well enough to start the tapering process.
The critical factors for the Fed to take this step was a rise in jobs and control of inflation. The job market has picked up, and inflation is soaring. The fast-tracking of the tapering is to increase interests rates sooner. Fed Reserve President Raphael Bostic has indicated his support to start interest rates hikes as soon as mid-2022.
The news will have an impact on the strength of the US dollar this Wednesday.
FOMC meeting minutes are due Wednesday, 24 November at 21:00 GMT+2
XAUUSD Technical analysis – Daily time frame
Analyzing the overall trend is the most crucial step in trading. Traders can use any strategy to do it. One of the best ways is to apply a 200 moving average in the chart or use any indicator that does the same.
Moving Average (MA)
By contracting the chart, we can see the overall market is moving up. The price was seen moving above the 200-moving and is now showing it is in a consolidation state.
Relative Strength Index (RSI)
We are applying RSI to check for overbought, oversold, or divergence on the higher time frame. RSI did not show any divergence and was seen touching the 70 overbought zones. The current RSI line shows the market is moving towards the 30 zones.
Technical Analysis using Price Action:
The market was trading at its current lowest on 9 August at around 1678.522. The candlestick then got closed near 1729.669. After that, the price made a good Doji candle, and since then, the market has been moving up.
Market after a successful lower high came to make a new swing low but was not successful, stopping at 1725.331 zones. We could not see the market heading up on the daily time frame, forming higher highs and higher lows. The price was able to break the 1834.230 resistance successfully, but at the same time, the market came crashing down and touched the short-term bullish trend line.
From the current position, the market needs to show more rejections on the lower time frame to confirm If it has to go up after the trend line touch.
Potential pivot points using Price Action:
Resistance Pivot
Support Pivot
R1
1837.00
S1
1789.00
R2
1867.70
S2
1771.70
R3
1885.00
S3
1741.00
This considerable resistance and support level can be used to enter or exit when approaching future market openings.
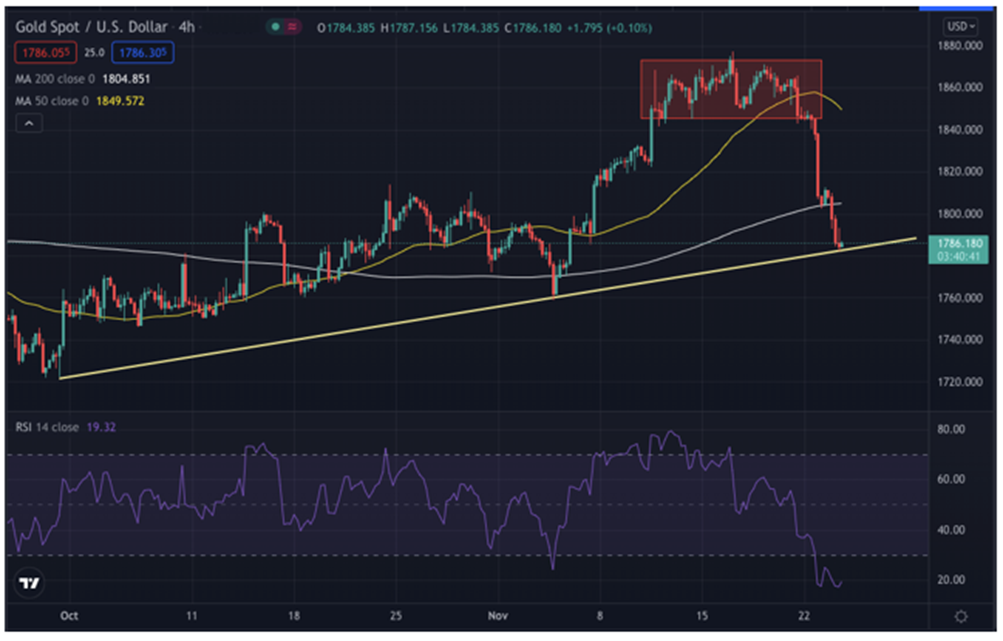
Technical Analysis – 4Hour Time Frame
On the lower time frame, we can clearly see the two moving averages, 50 and 200 crossing each other. The 50 moving average crossed the 200 moving average forming a golden cross.
As seen on the daily time frame, the market was moving up. On the lower side, we could see the market was trending and in a range state for a while until breaking out. The fall is sharp and is nearly 62 pips. Currently, the price is holding the short-term bullish trend line, and traders can wait for some rejection.
If the market makes some reversal candle, traders can go long, keeping a tight stop loss, and if the price continuously falls, traders must wait for the retest.
Key Trading Recommendation
XAUUSD is a highly volatile currency pair and can move 100-120 pips during significant news events.
Furthermore, the Federal Open Market Committee will affect the USD currency. Every trader and investor has their eyes on it; waiting for the right move would always be the best risk management strategy.
Although a large number of traders would not place their trades before the news, you too can consider doing the same.